
You can use Sedrix to import and evaluate measurements from inclinometer probes. Common evaluations are:
- Measured value table and measured value diagram
- Borehole trajectory (table and diagram)
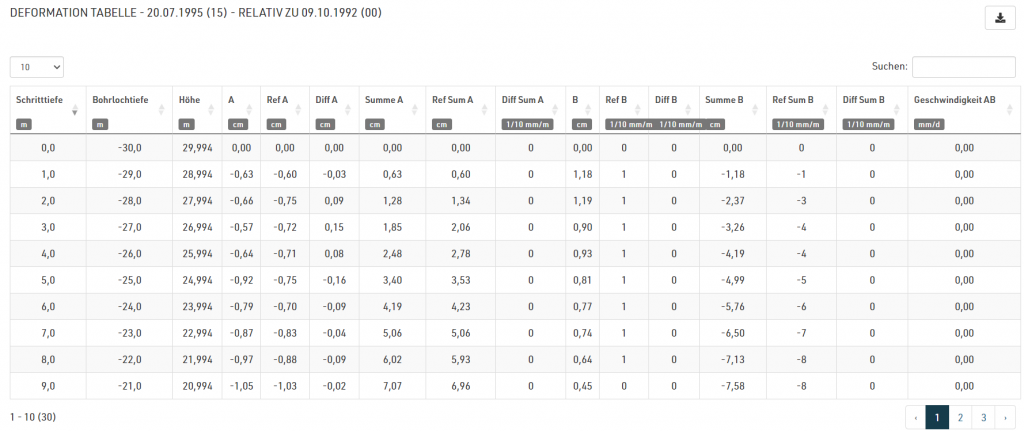
- Deformation (table and diagram)
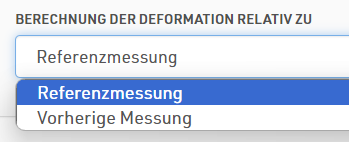
Deformation generally shows the trajectory of a borehole relative to the reference measurement. In this version it is now possible to calculate the deformation relative to the previous measurement. This is ideal for tracing changes from measurement to measurement.
This option can be selected in the evaluation properties:
Version 5.4.8
28.06.2024
New features
- Measuring point channels can now be displayed (again) in the visualization.
- Inclinometer measurement: In a deformation table it is now possible to display the deformation relative to the previous measurement.
- Seismic measurements: third-octave diagrams of a seismic event can now also be exported as CSV tables.
Fixed bugs
- When duplicating measuring points, not all properties were copied (e.g. tolerance interval).
- If many logbook entries were to be displayed in a diagram, it was possible that some were not visible.
- Seismic measurements: When hiding large numbers of events, it was possible that not all interval data was hidden.
- Seismic measurements: There was a discrepancy in how interval data diagrams were displayed on the web and in the report.
- Saving changes to a visualization sometimes failed in Firefox.

