
Support for Campbell Scientific Data Logger
Our goal is to make it possible for you to have as many of your devices as possible in one place: in SDC. We are therefore pleased to announce a new entry in the ranks of devices that we support: TOA5 files from Campbell Scientific can now be imported into SDC. This means it is now possible to integrate Cambell Scientific devices, such as the CR1000X, into an SDC system.
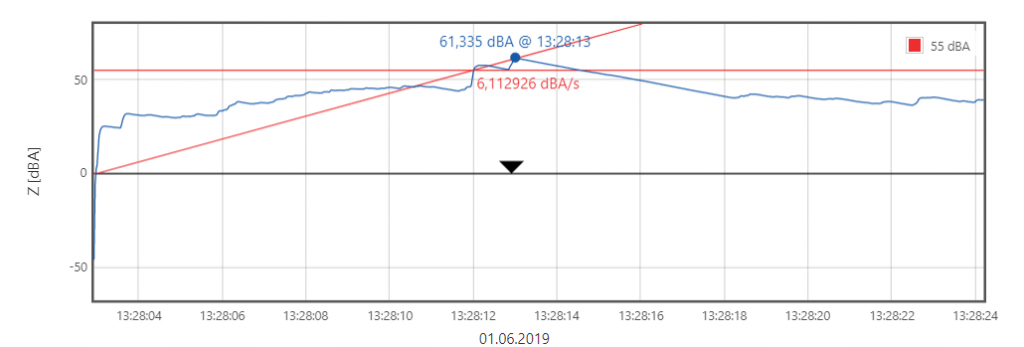
Edge steepness and 55 dB limit for secondary airborne sound diagrams
For secondary airborne sound diagrams in the vibration measurement module, a line with the threshold value 55 dB can now be displayed. If the secondary airborne noise exceeds this limit, the edge steepness is also displayed as an indicator for the speed of the rise in noise. The button for edge steepness is now displayed in the diagram for secondary airborne sound. By clicking on this button, you can show or hide the threshold line/edge steepness, when the graph exceeds the threshold.

Version 4.7.0
29.03.2021
New features
- Import of Campbell TOA5 format
Data logger files from Campbell Scientific in TOA5 format can now be imported into SDC. This means that is now possible to integrate Campbell devices, such as the CR1000X , into an SDC system. - New data source – MQTT data source
With this data source, Glötzl-LoRa-Funk-Sensoren can now be evaluated in SDC. - Edge steepness and 55 dB limit for secondary airborne sound diagrams
For secondary airborne sound diagrams in the vibration measurement module, a line with the limit value 55 dB can now be displayed. If the secondary airborne noise exceeds this limit, the edge steepness is also displayed as an indicator for the speed of the rise in noise. - Assignment of cost centers to SDC objects
The following SDC objects can now be assigned a so-called cost center: alert definitions, user groups, report templates, document measuring points, as well as vibration measurement, logger, inclinometer and tachymeter devices. This information can be used to create statistics, for example for accounting purposes. This can be used, for example, to determine how many alert SMS message the cost centers send in a certain period of time etc.
Fixed bugs
- Creating reports from user-defined document templates did not function correctly in all cases. This has been corrected.
- When calculating edge steepness, depending on the signal curve, values occurred that were too small. The calculation process has been changed.