
Your benefits
Unique
In the office or on site, on a laptop or a smartphone, with Android, Apple or Windows: SEDRIX gives you access to your data whenever you need it. Anywhere, anytime.
Secure
Access your data securely from anywhere. Control permissions for users, individually or in groups, and share data with clients. The choice is yours, and you always stay in full control.
Vendor-independent
Whatever the device, manufacturer or file format, all your measurement data comes together in one single place. If something you need is missing, we will gladly add it.
Clear
The dashboard shows the current project status at once. Charts and tables present the data exactly the way you need it. Folders and customizable site maps keep even large projects clear.
Informative
Create comprehensive, meaningful reports in a few clicks, tailored to your needs. Adapt analyses and presentation freely and automate report generation on your schedule.
Vigilant
Monitor the state of your measurement network live and configure alarms and warnings. When an alarm is raised, every responsible user is notified immediately – even on the move.
Modules
SEDRIX covers a wide range of applications and devices. Core functions such as device monitoring, alarming and access management are always included. Support for further data and device types is added flexibly when you need it, so you never pay for more than you use.
General time-value measurements
Collect and analyze any measurement data that your measuring systems and data loggers deliver via FTP or web API. Filter and combine the data, and calculate with predefined function blocks or your own formulas. More on time-value measurements
Vibration measurements
Vibration events recorded by your devices are assessed according to national standards such as DIN 4150-3, VSS 40312 or ÖNORM S 9020 and analyzed in charts. An optional add-on also lets you manage blasts. More on vibration measurements
Geodetic measurements
Collect and analyze total station data for the spatial monitoring of structures, tunnels or tracks (optional track monitoring add-on) and visualize deformations. More on geodetic measurements
Inclinometer measurements
Record and analyze manual measurements with inclinometer probes in SEDRIX. Charts and tables for displacement, deformation and borehole course keep everything in view. More on inclinometer measurements
Documents
Even measurement data that only exists as a document, for example a PDF, can be integrated into SEDRIX. Document measuring points are handled like those of the other modules, including manually raised alarms.
What we offer
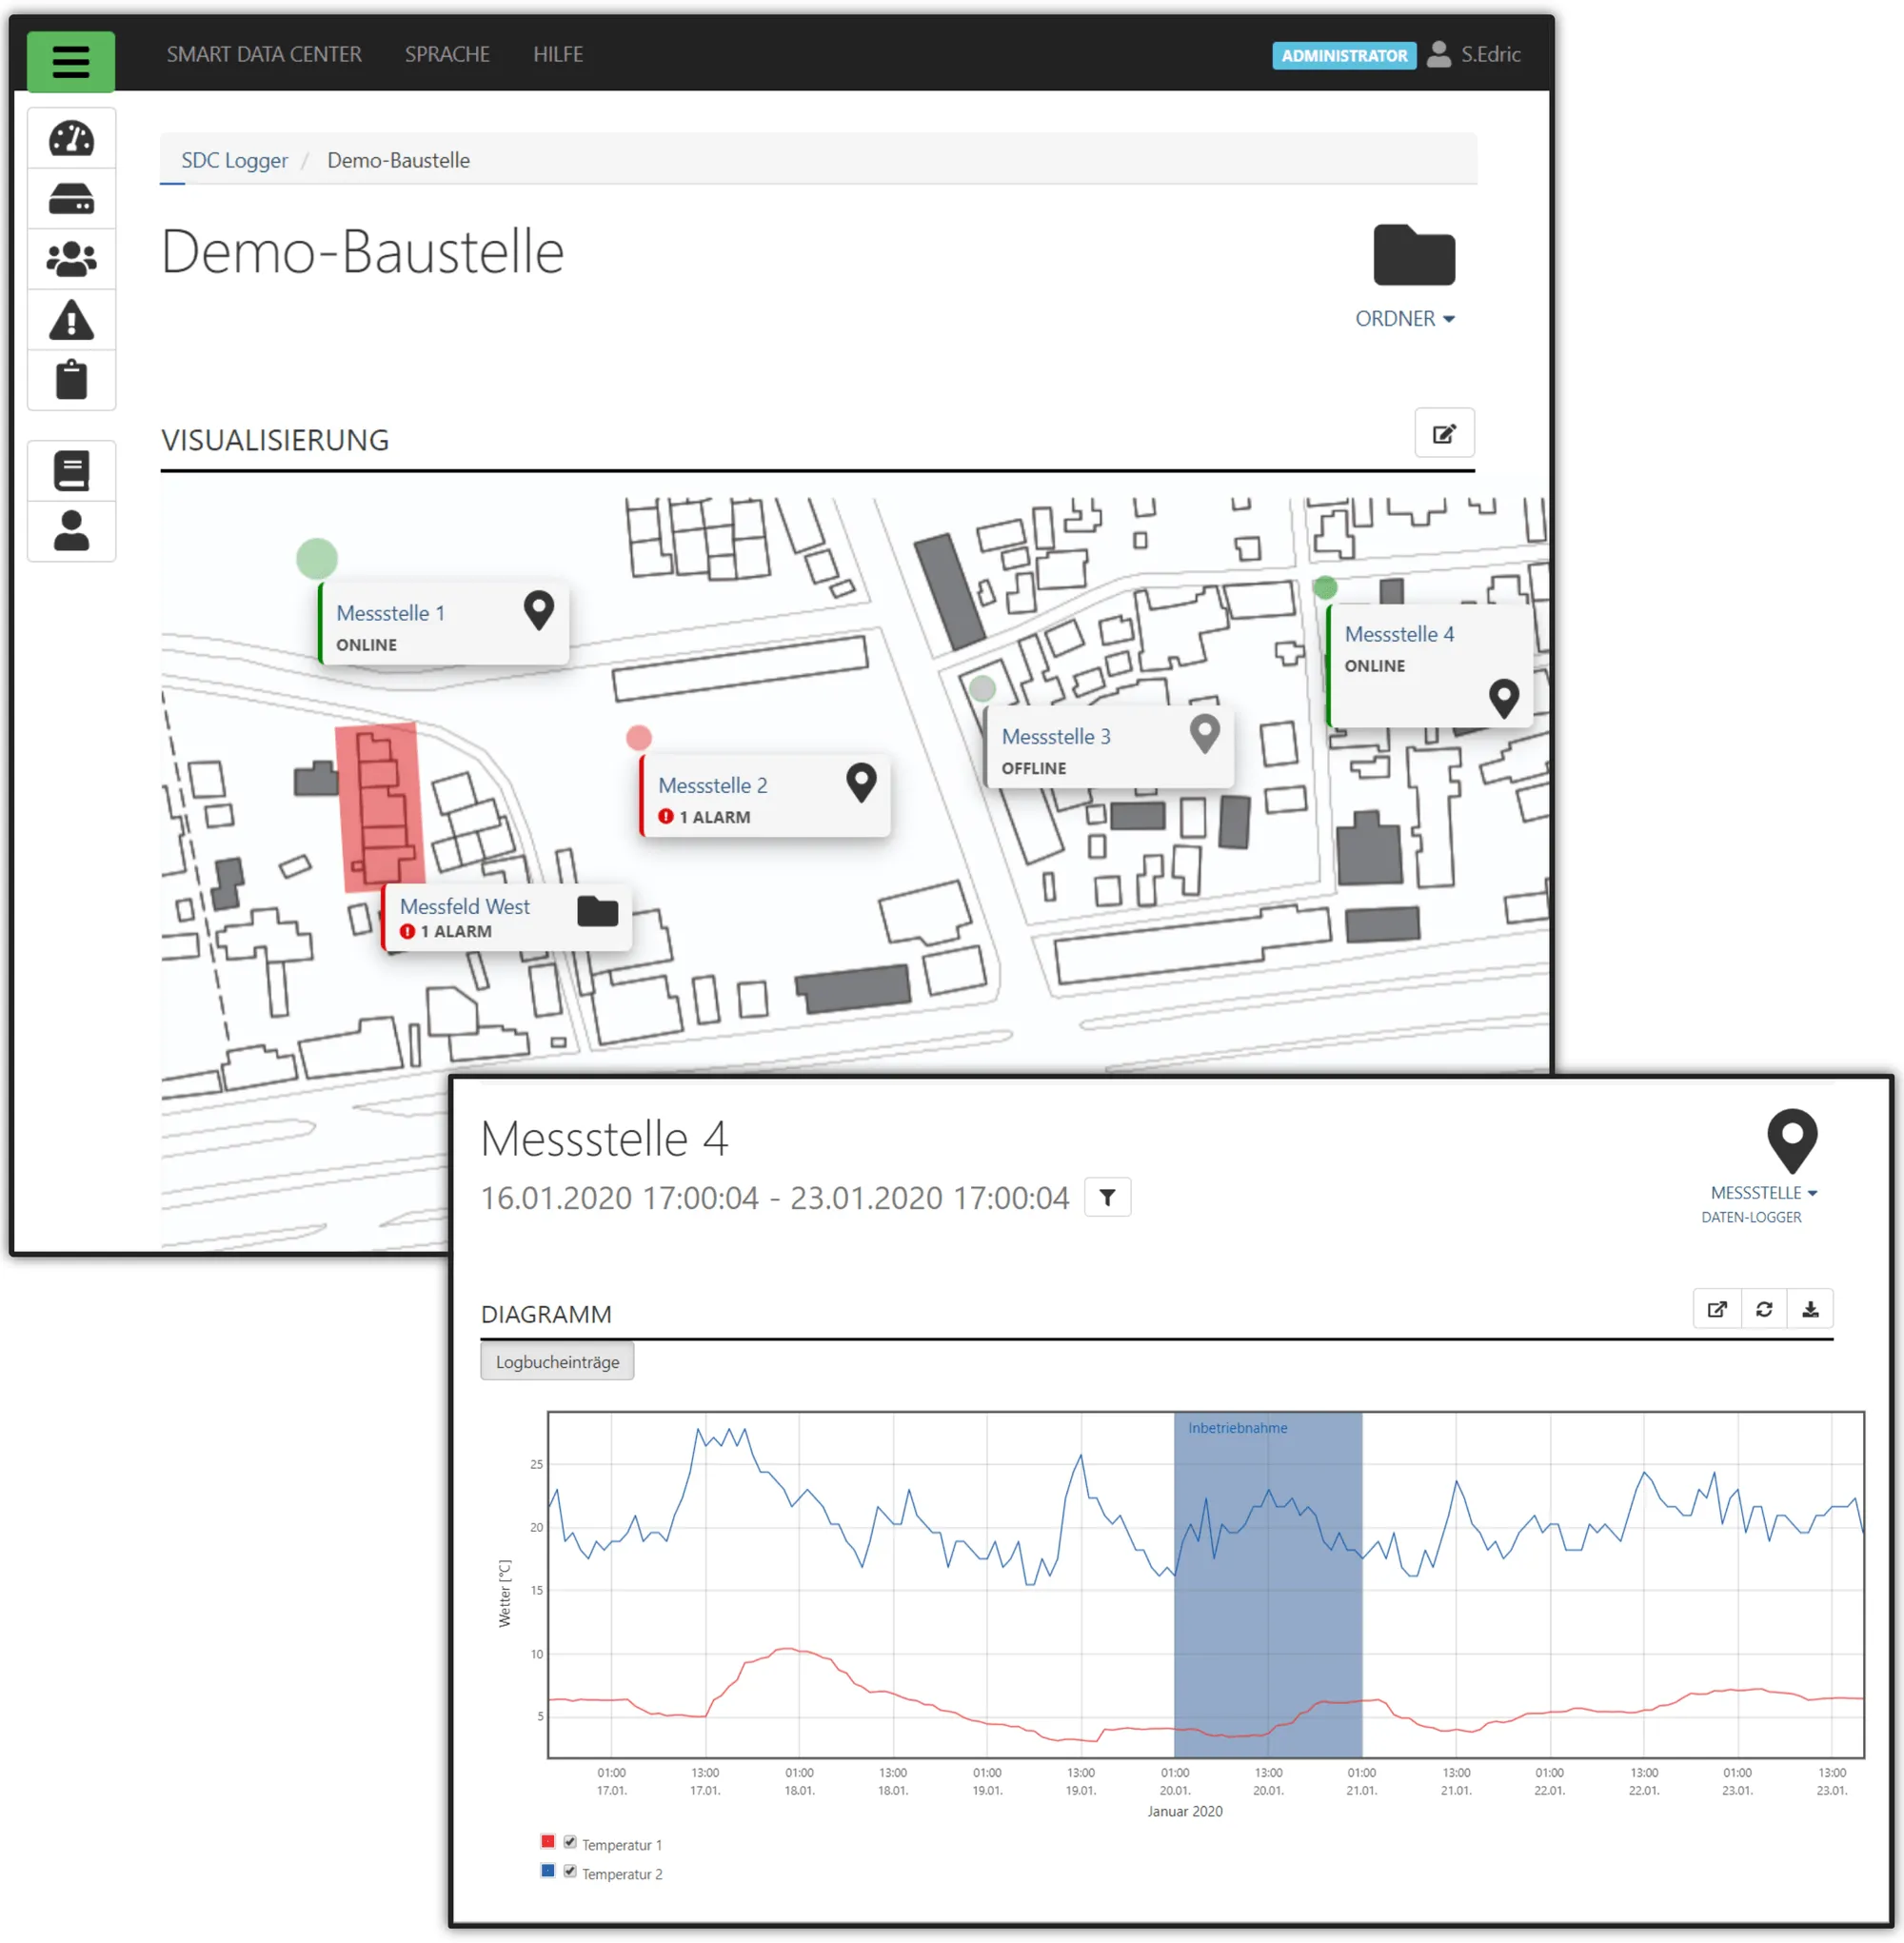
Hierarchical menu
To keep track even in complex scenarios, organize measuring points in a logical folder hierarchy.
Online status
See at a glance which measuring points have current data. A measuring point that is offline is shown in grey.
Alarming
The color of measuring points and folders shows directly whether alarms have occurred. Click an element to see the details.
Visualization
Besides the folder hierarchy, measuring points and folders can be shown on a site plan (any image file). You see at a glance whether all devices are online and where alarms have occurred.
A folder combines the alarms of all measuring points below it. Click the folder to open the next level of detail and see which measuring points raised the alarms.
International
Set the time zone and location for each project individually. Date, time and number formats follow the selected region, and the user interface is available in several languages.
Cross-analyses
Analyze the data of each measuring point with function blocks and present it in charts and tables.
Cross-analyses combine the data of several measuring points, even of different types. For example, link data from inclinometers, total stations and data loggers.
Reports on demand
Present data in reports. Adjust the content directly in the system and the layout through a Word template, for example to match your corporate design.
On request, SEDRIX uses this template to generate reports as Word files regularly and fully automatically.
Custom export
All data can be exported as CSV files. We add custom formats on request.
Logbook
Logbook entries show important events or project phases in charts, such as a temporary sensor fault or the commissioning phase.