Import
We support measuring systems and data loggers from Glötzl, Campbell Scientific, Solexperts, Senceive and other manufacturers.
Transfer your data the classic way via FTP, through a web API or by importing from an MQTT server. Thanks to the flexible architecture, we add further formats for special requirements and complex exchange scenarios. Talk to us and we will find a solution!
Monitoring
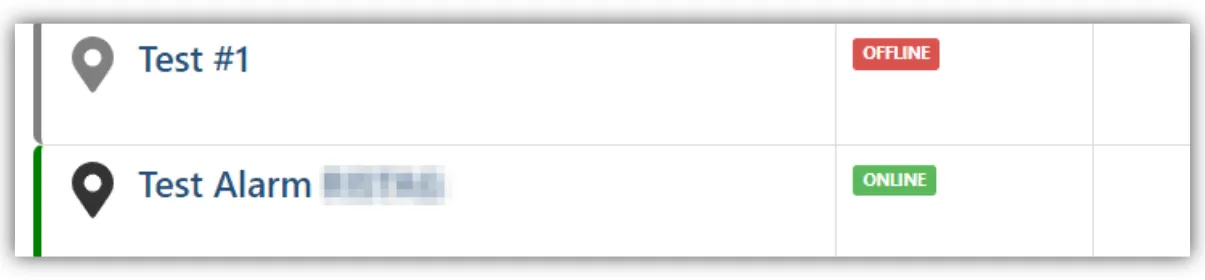
Monitor all devices and data sources at a glance and see which device last transmitted data and when.
If a device fails, the alarm system automatically notifies service technicians by email, text message or phone call. Failures are detected quickly and fixed promptly.
Alarming
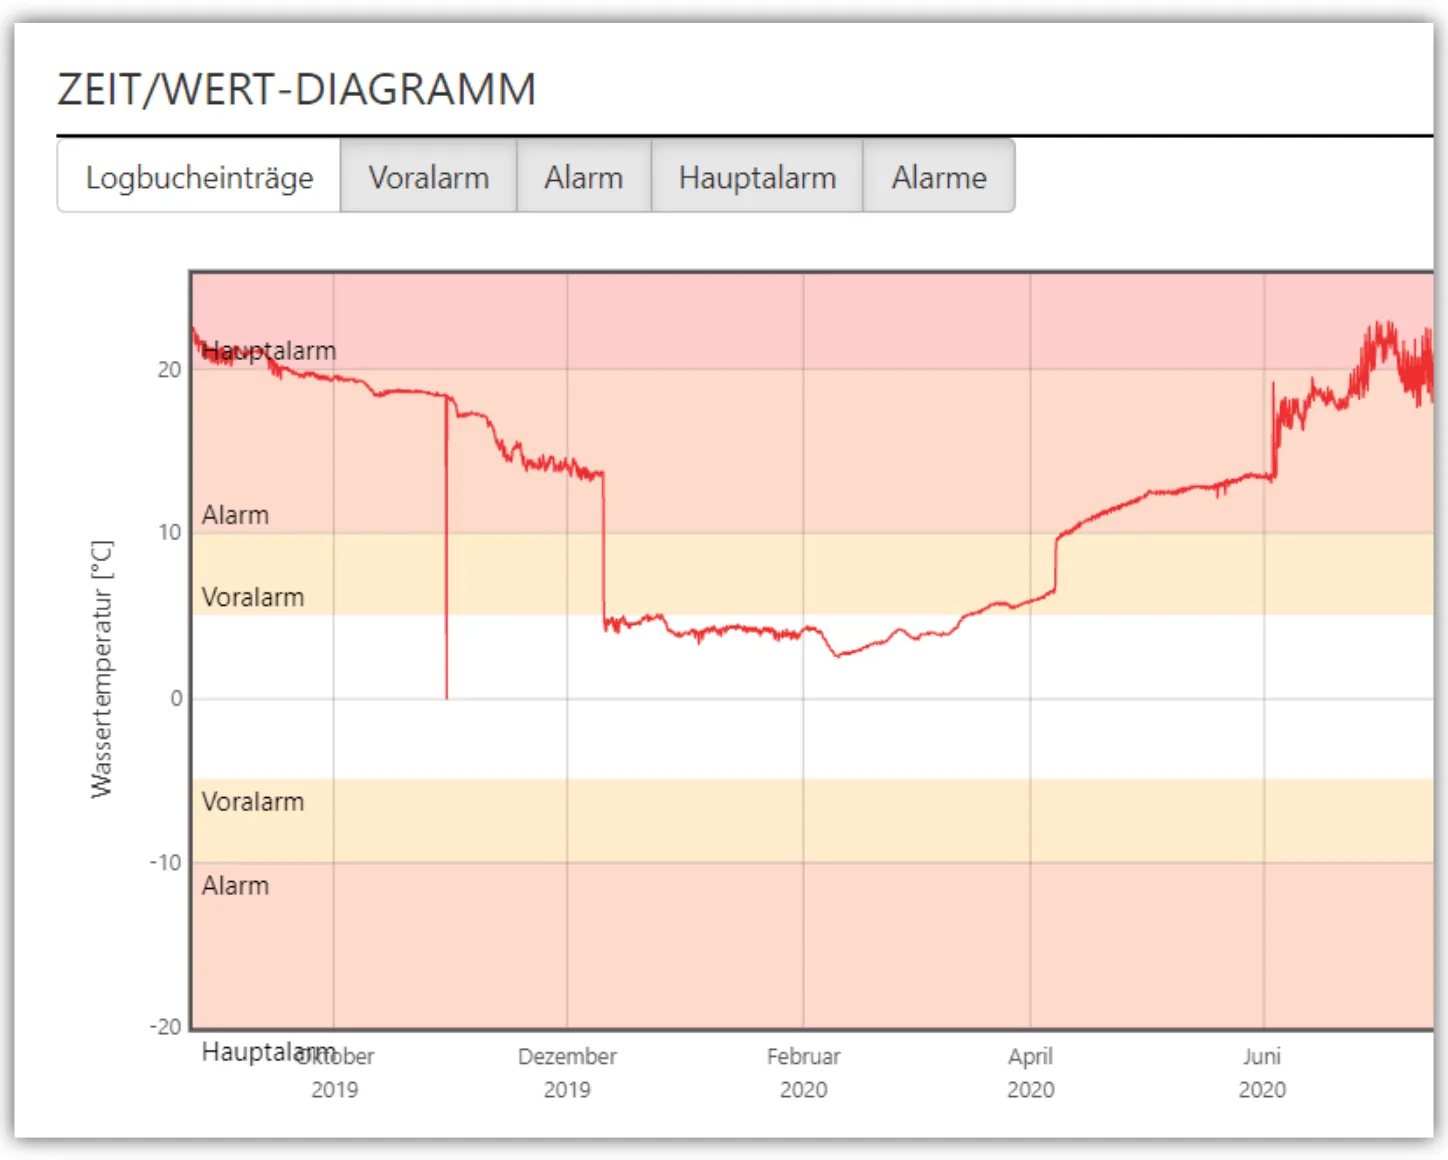
Sophisticated analysis options continuously check measured values against predefined limits.
When an alarm condition occurs for a channel, SEDRIX raises an alarm. It is visible at a glance in the overviews, and the visualization colors measuring points and folders by severity. Three alarm levels are available, which you name and define freely.
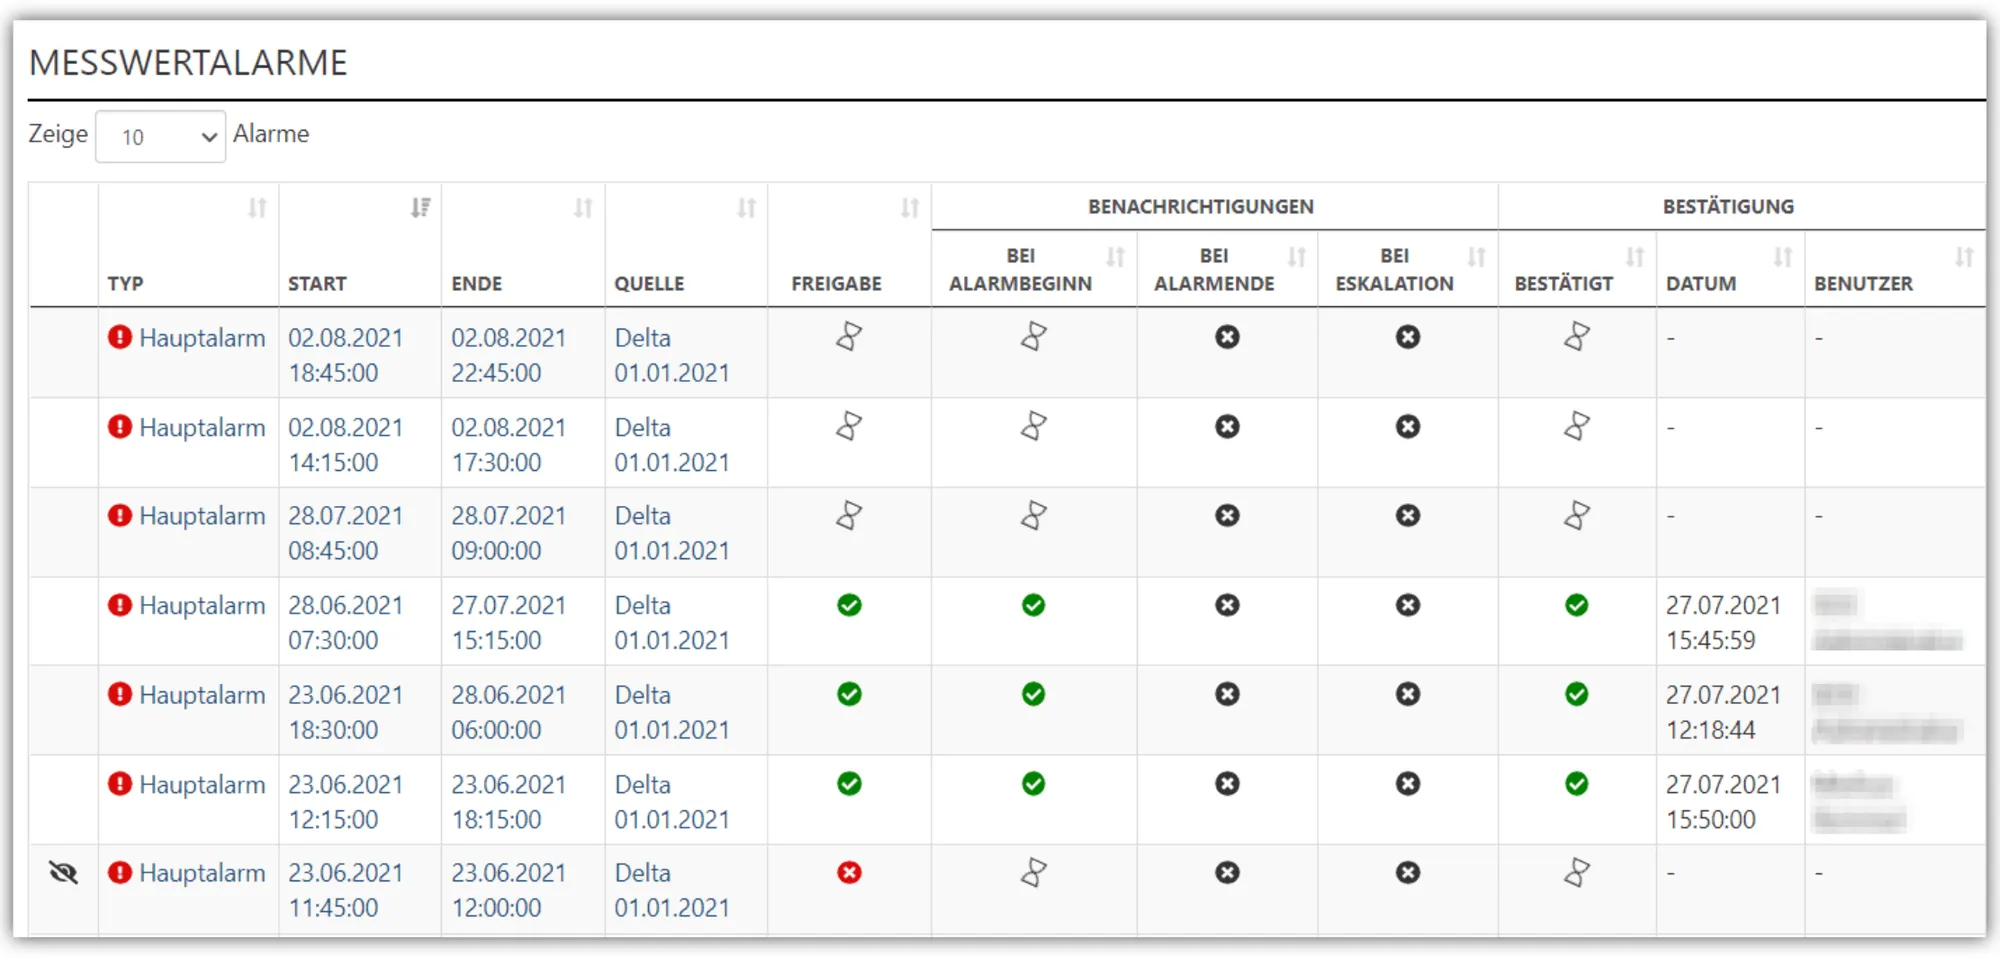
When an alarm starts or ends, user groups are notified by email, text message or phone call. Complex alarm scenarios are possible as well:
- Service technicians release and assess alarms before further staff are notified.
- Designated users acknowledge alarms, and SEDRIX logs who acknowledged each alarm.
- If an alarm is not acknowledged within a set time, an escalation notification follows.
Analysis
Pre-processing of measurement data
- Hide invalid measurement data and mark it accordingly.
- Dedicated features make replacing a faulty sensor easy: record the failure and change offsets or other channel parameters centrally, so downstream calculations need no changes after a sensor swap.
- Convert and filter input data, for example with a moving average or a variance filter.
Function blocks
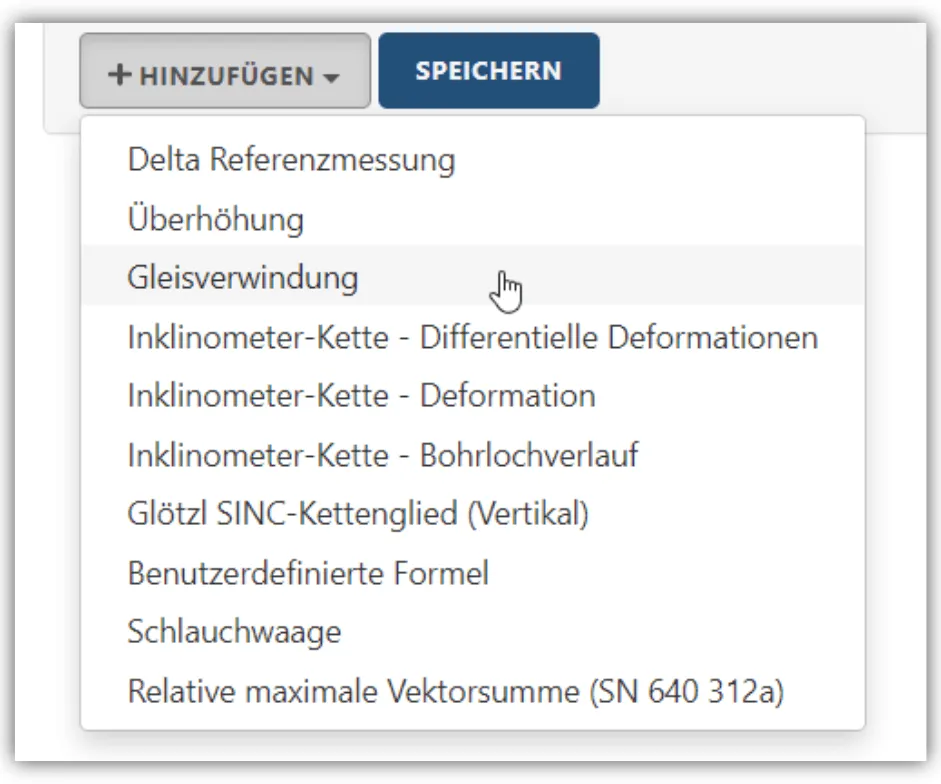
Function blocks automate complex, recurring calculations and analyses. Afterwards you only need to assign the channels.
- Difference to a reference measurement
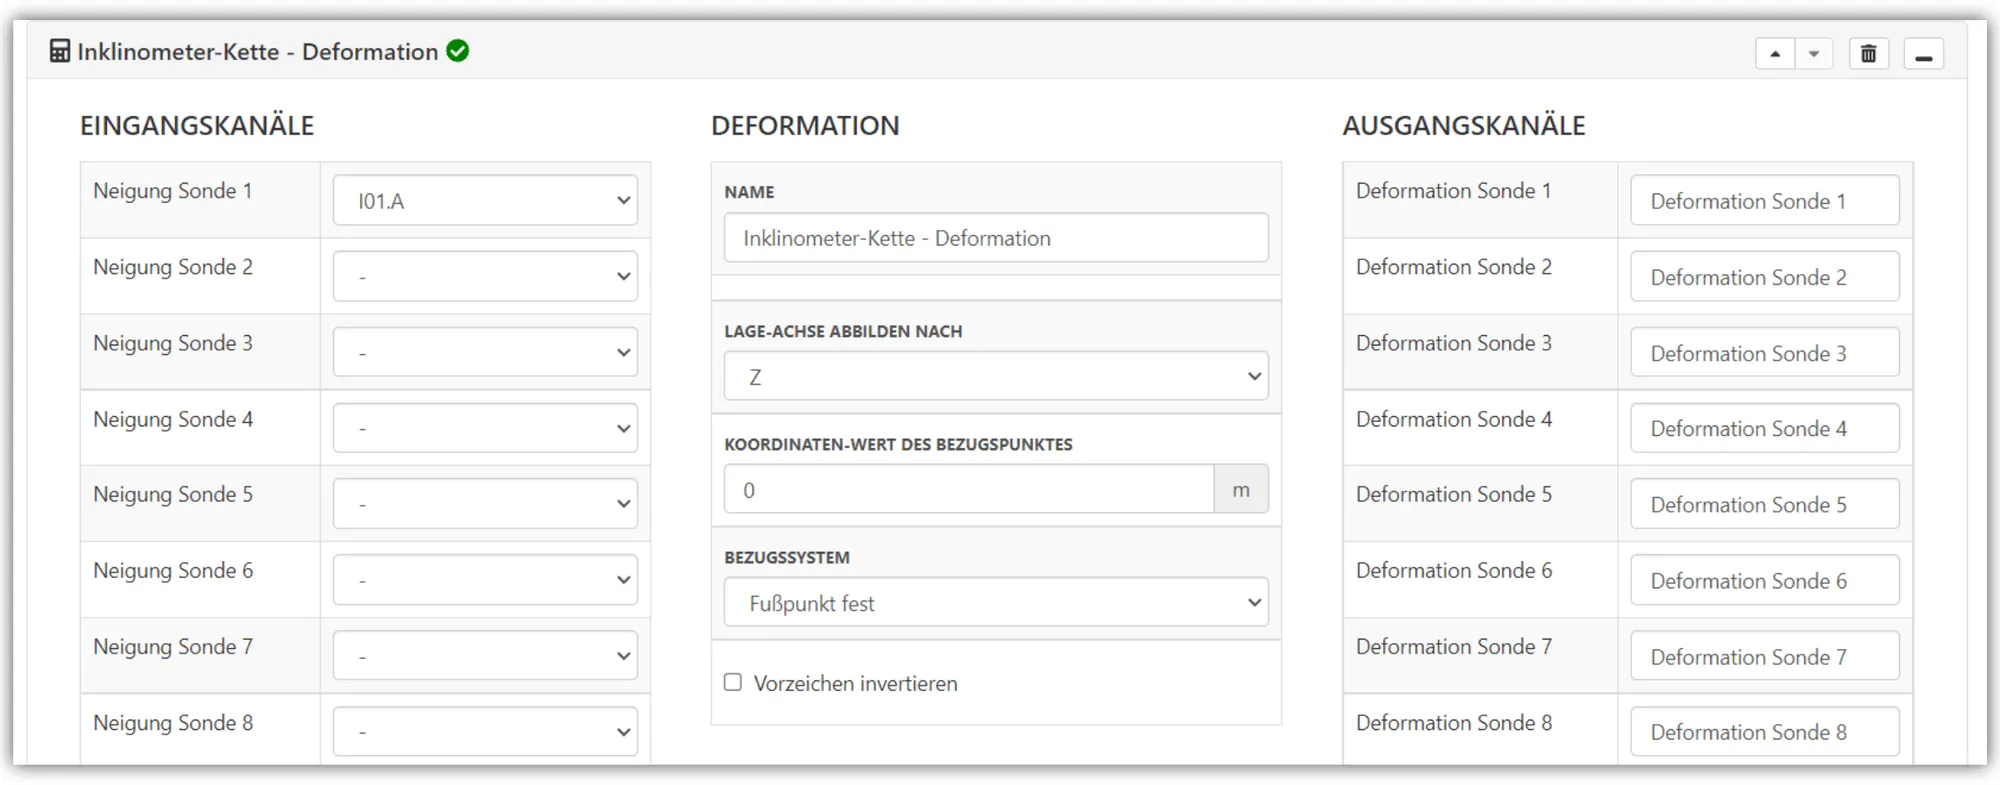
- Analysis of inclinometer chains: differential deformation, deformation and borehole course
- Analysis of hydrostatic levelling systems
- Track monitoring with inclinometer sensors: calculation of twist and cant
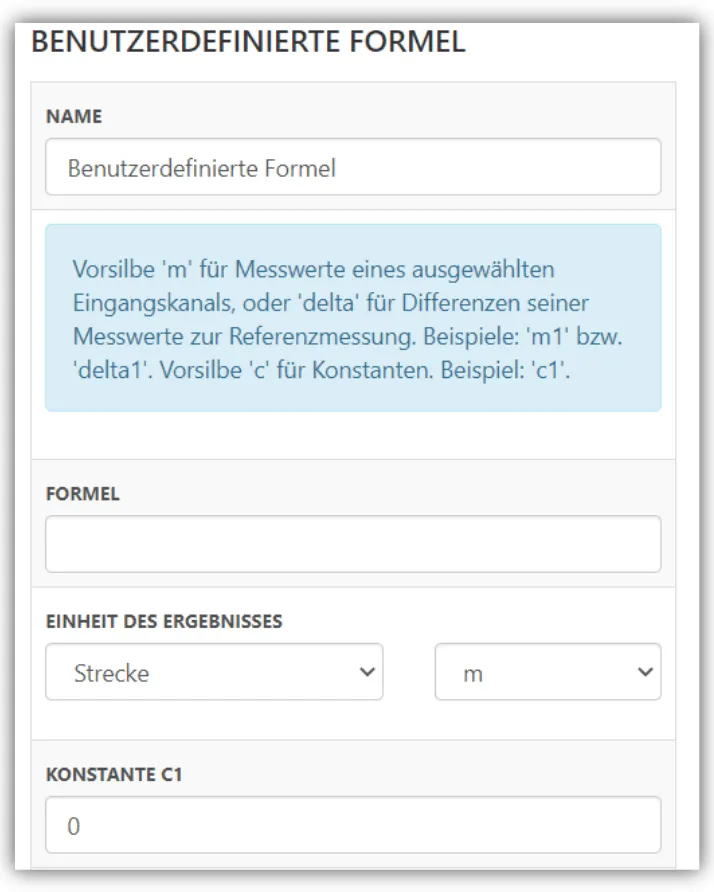
- User-defined function blocks with your own, even complex formulas
- Calculations across channels of any data source, even with different timestamps and measuring intervals
Presentation
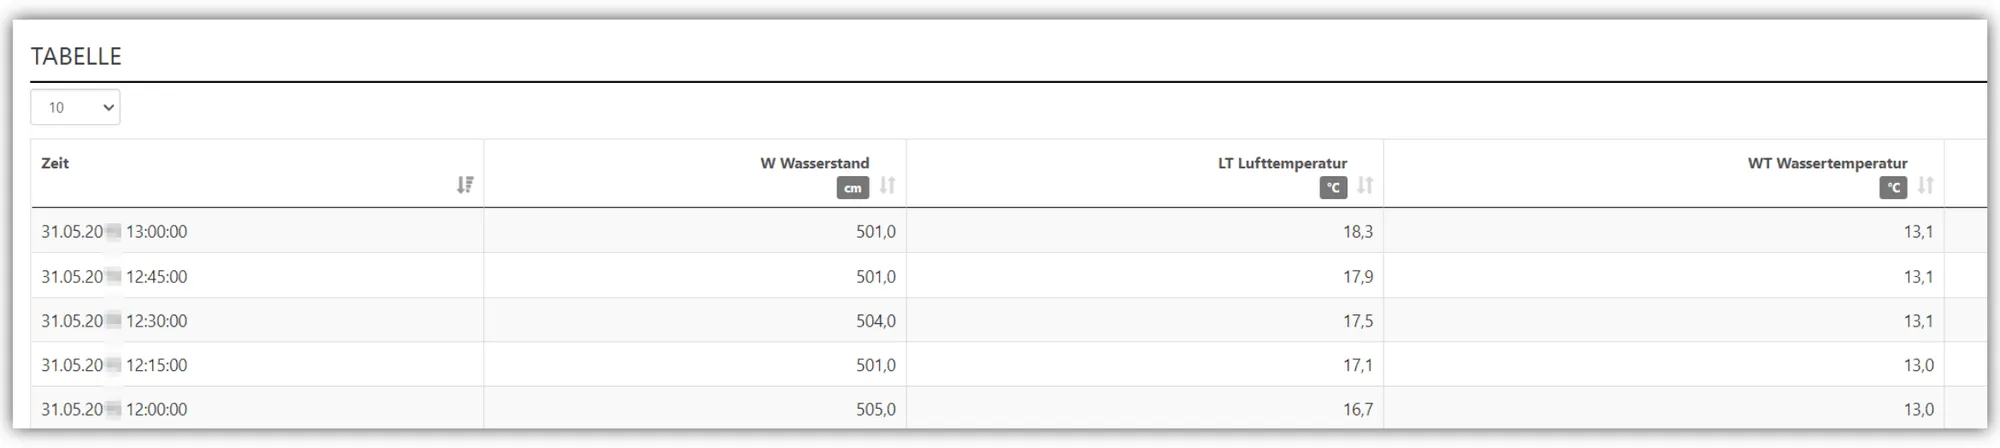
- Many ways to present measurement data in charts, tables and vector graphics
- Several views per measuring point, in which you freely choose which charts and tables appear – for example a polished view for the client and a more detailed one for the technician. Switch between views at any time.
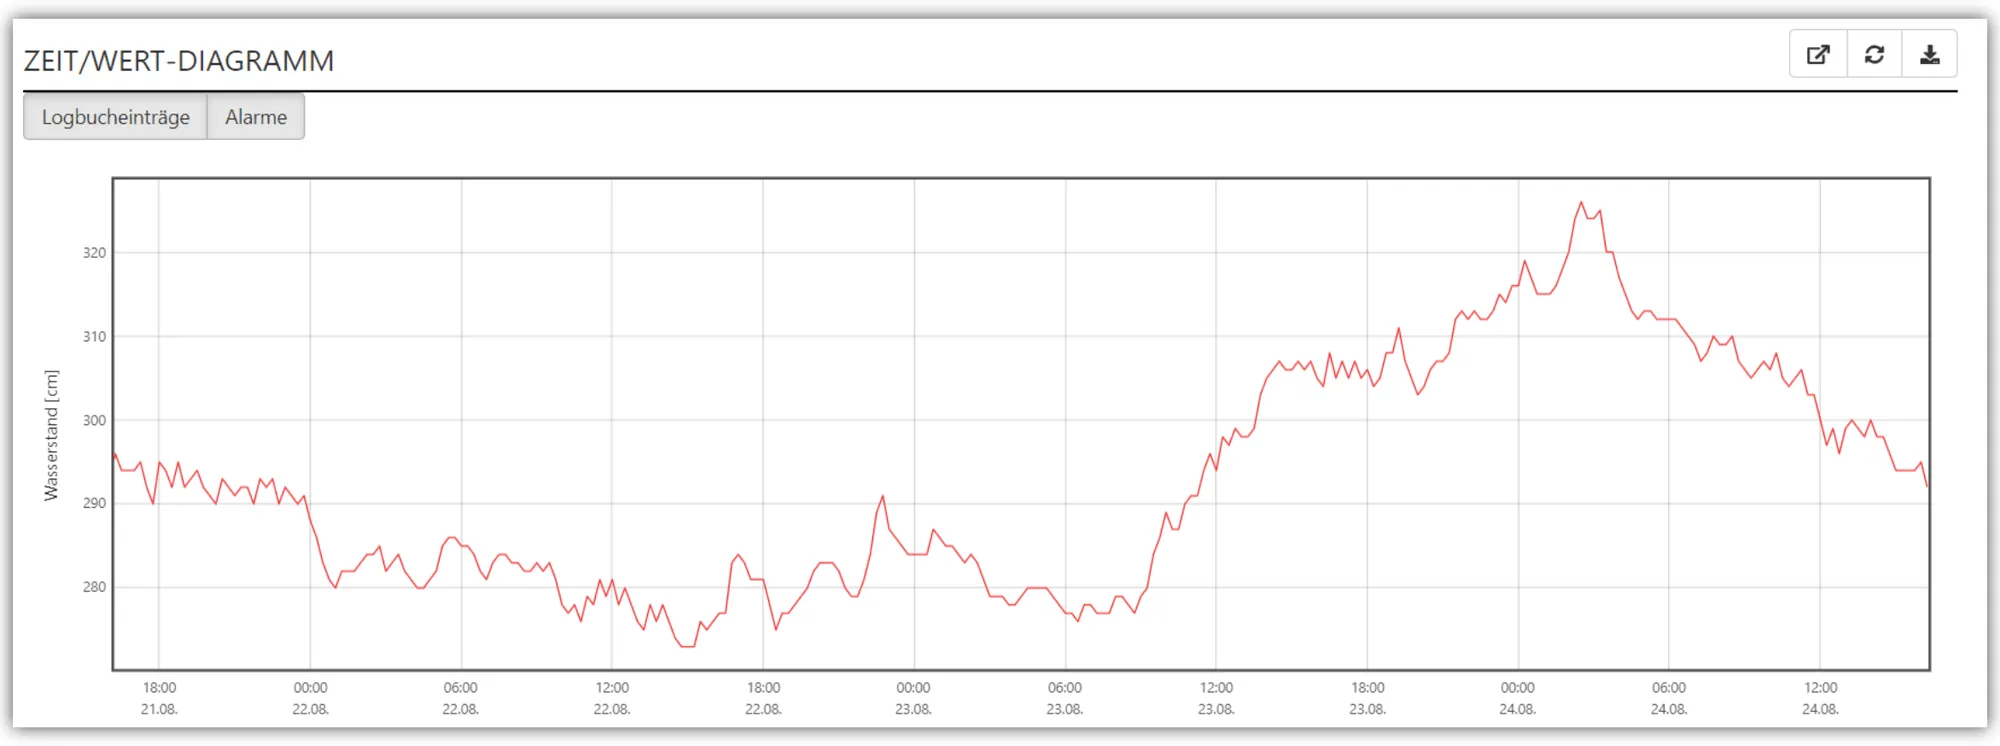
- Customizable time-value charts and tables
- Position-value charts and tables
- Vector graphics in which any two channels form a vector arrow that you place freely on an image
Reports
Existing analyses serve as the basis for reports, or you use reports configured specifically for that purpose.
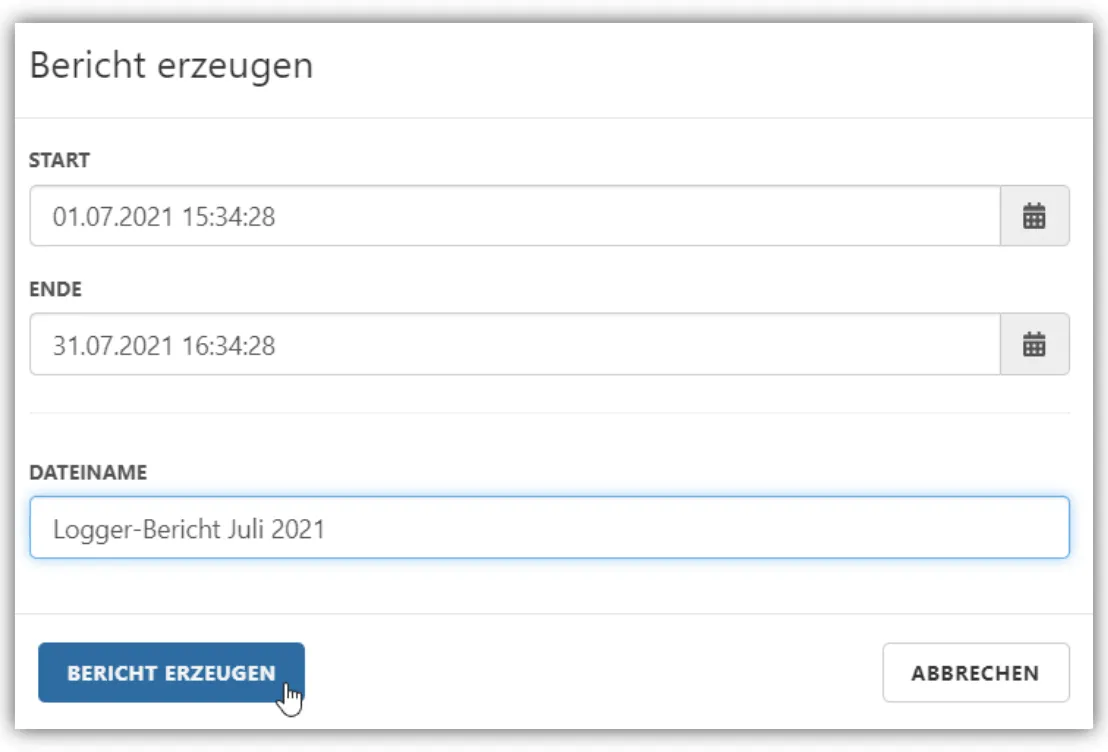
Create Word reports manually at any time or automatically at set intervals. For example, a report on the previous month is created automatically on the first day of each month and sent by email. On request, we adapt every report template to your corporate design.
Export
Export the data of every chart and table in CSV format at any time. You can also set up automated export jobs that export data in common formats on a schedule and, for example, upload it to an FTP server.
Customizing
Thanks to a flexible and extensible architecture, we implement special requirements with little effort and integrate them seamlessly into SEDRIX. Our agile development team looks forward to hearing about your challenge and finding a tailor-made solution.